Reports
Overview:
The Reports module aggregates and displays key advertising performance data, including spend, impressions, clicks, and conversions. It supports multi-dimensional and multi-granularity data viewing and analysis.
You can customize the dimensions and metrics displayed, and select key events of interest to help optimize your campaign performance.
Supported Report Types:
The TaurusX Advertising Management Platform offers the following three types of reports to meet various operational analysis needs:
- Custom Reports: Flexible dimension and metric selection, with custom filtering and sorting.
- Hourly Reports: View campaign data at an hourly granularity to identify real-time fluctuations.
- Publisher ID Reports: Analyze performance based on Publisher ID to evaluate the quality of different traffic sources.
Custom Reports
Description:
Custom Reports allow you to freely combine dimensions and metrics based on your business needs. They support event selection, conditional filtering, data sorting, and exporting. Ideal for detailed performance analysis of campaigns, creatives, and targeting strategies.
Key Features:
- Support for selecting delivery dimensions (e.g., campaign, ad group, ad, region).
- Support for selecting conversion events (including App Events, Pixel Events, and API Events).
- Multiple metrics supported, such as impressions, clicks, CTR, CVR, CPI, ROAS, etc.
- Data can be aggregated by hour, day, week, or month.
- Interactive line charts visualize data trends over time.
- Reports can be saved as templates for reuse and team sharing.
- Exportable as CSV for offline analysis.
Use Cases:
- Analyze how a campaign strategy performs across platforms or regions.
- Compare click-through and conversion rates of different creatives.
- Track conversion trends during a specific promotional event.

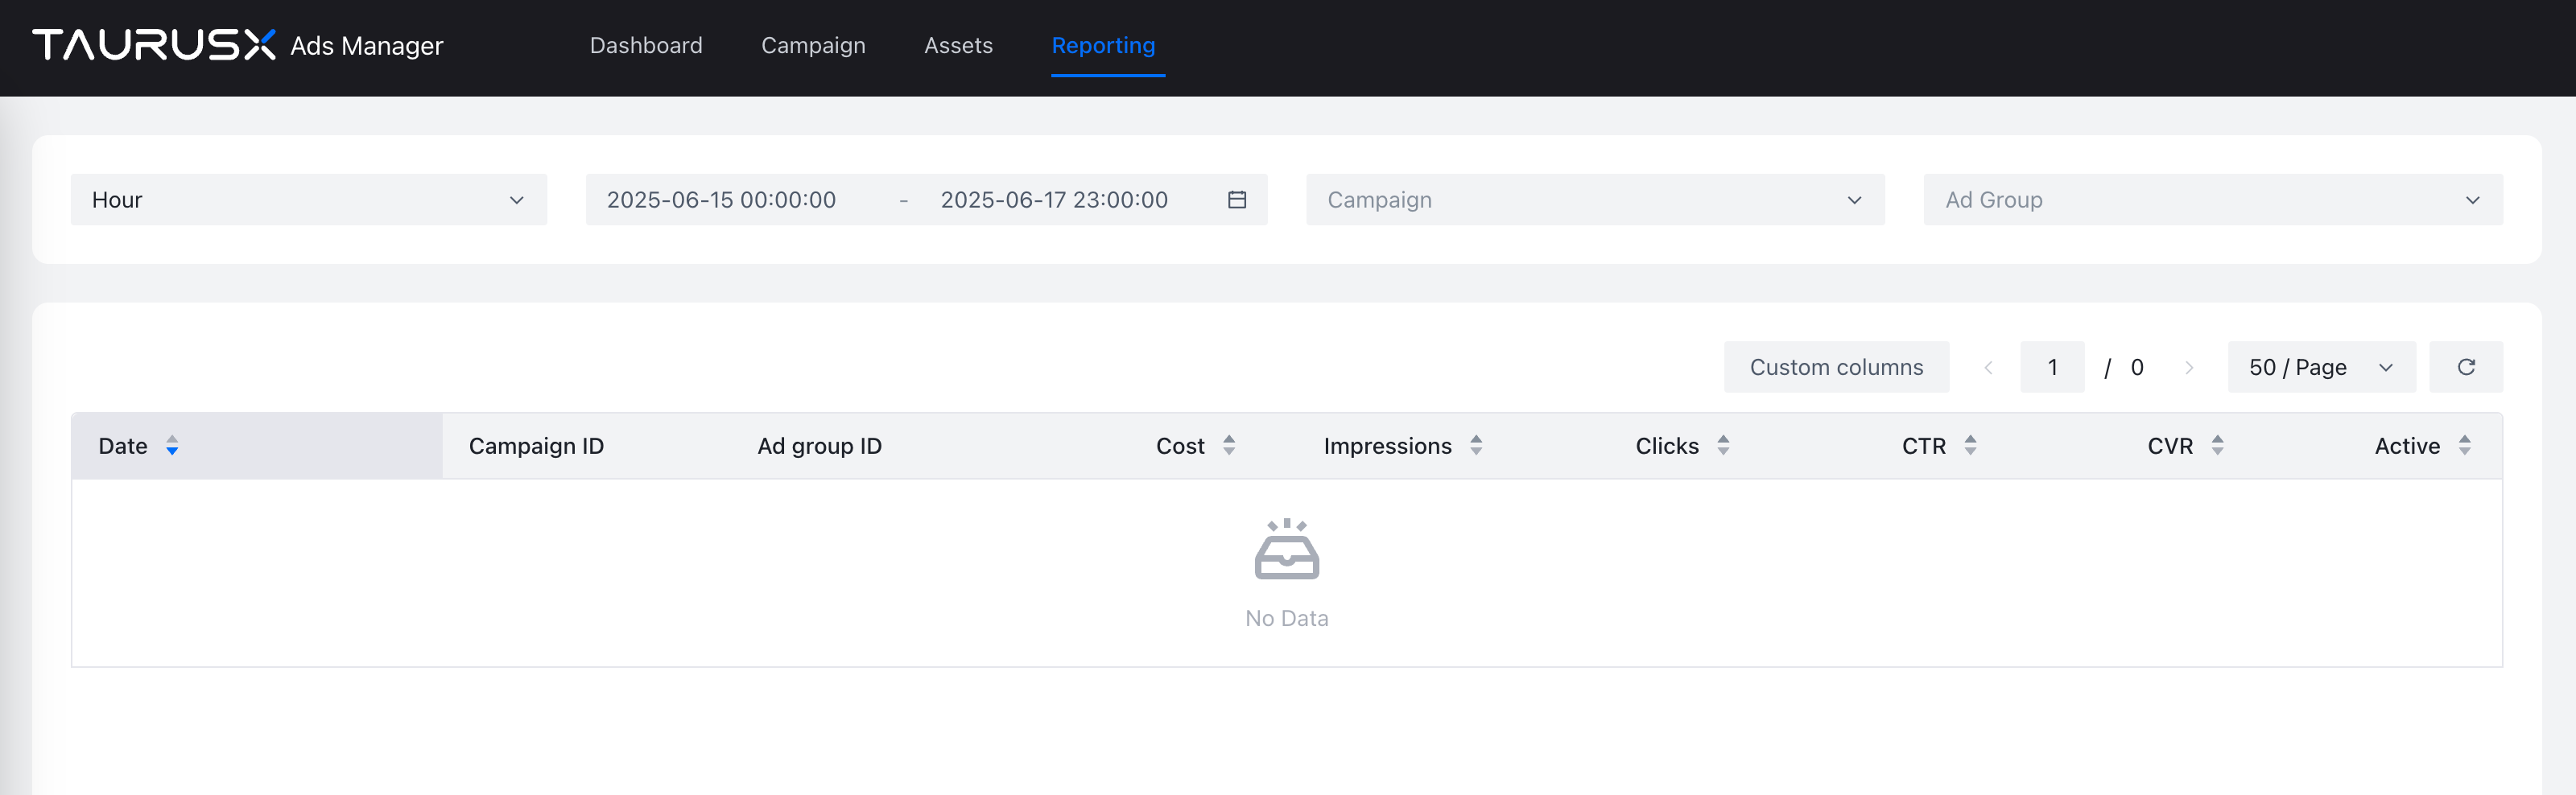
Hourly Reports
Description:
Hourly Reports provide more timely delivery performance data by the hour, enabling advertisers to identify fluctuations more precisely and optimize delivery schedules or budget allocation accordingly.
Key Features:
- View hourly metrics including spend, impressions, clicks, and conversions.
- Support filtering by date, campaign, ad group, ad, and more.
Use Cases:
- Identify peak and off-peak performance hours throughout the day.
- Determine whether time-based ad scheduling or segmented budgeting is needed.
- Monitor performance fluctuations after launching a new ad in real time.
Publisher ID Reports
Description:
Publisher ID Reports display data segmented by Publisher ID, helping advertisers evaluate which specific traffic sources perform better. This allows for precise optimization or blocking of underperforming sources.
Key Features:
- Show key metrics per Publisher ID: impressions, clicks, conversions, spend, etc.
- Cross-filter with dimensions such as campaign, ad group, and ad.
- Sort and filter to quickly locate high-performing or problematic sources.
- Exportable data for traffic analysis or blacklist management.
Use Cases:
- Evaluate high-quality media sources for a given campaign.
- Identify high-converting Publisher IDs to increase bids.
- Detect and block Publisher IDs with abnormal spend patterns.
